The Consumption Data Model
General Approach
When creating new, or modifying pre-defined dashboards, all data available for your visuals will be listed in the right panel of the Power BI embedded editor (see Accessing the Consumption Data Model). There you will find multiple tables with different fields available to you. This document is intended to provide you with an overview of the different tables available, as well as the associations among them. You can think of these tables as a normalized model. In general you can use fields from different tables in the same visualization, as long the tables are related through an association, either directly or indirectly. The diagrams below should help you understand these associations.
Note
Note that the diagrams are not necessarily showing all associations, but only the most relevant.
Feel free to try them: if you pick fields from two tables that are not associated, you can just remove the last added field, and keep working on your new visualization.
octoplant Servers and User Management
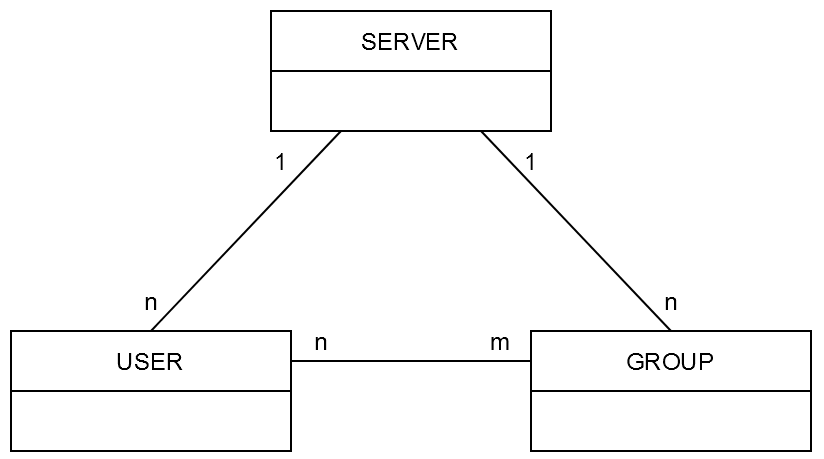
All octoplant servers can be accessed from the table SERVER. Note that this table is associated with all other tables, if not directly, indirectly.
The user management area is covered with two tables: USER, containing all octoplant server users, and GROUP, that has the definition of user groups of the octoplant servers. This information can be used in isolation, but is also very useful as a dimension of, for example, Component Status.
Data relationship model diagram for servers and user management:
Components and Versions
Multiple tables exists to represent different aspects of the octoplant components and versions.
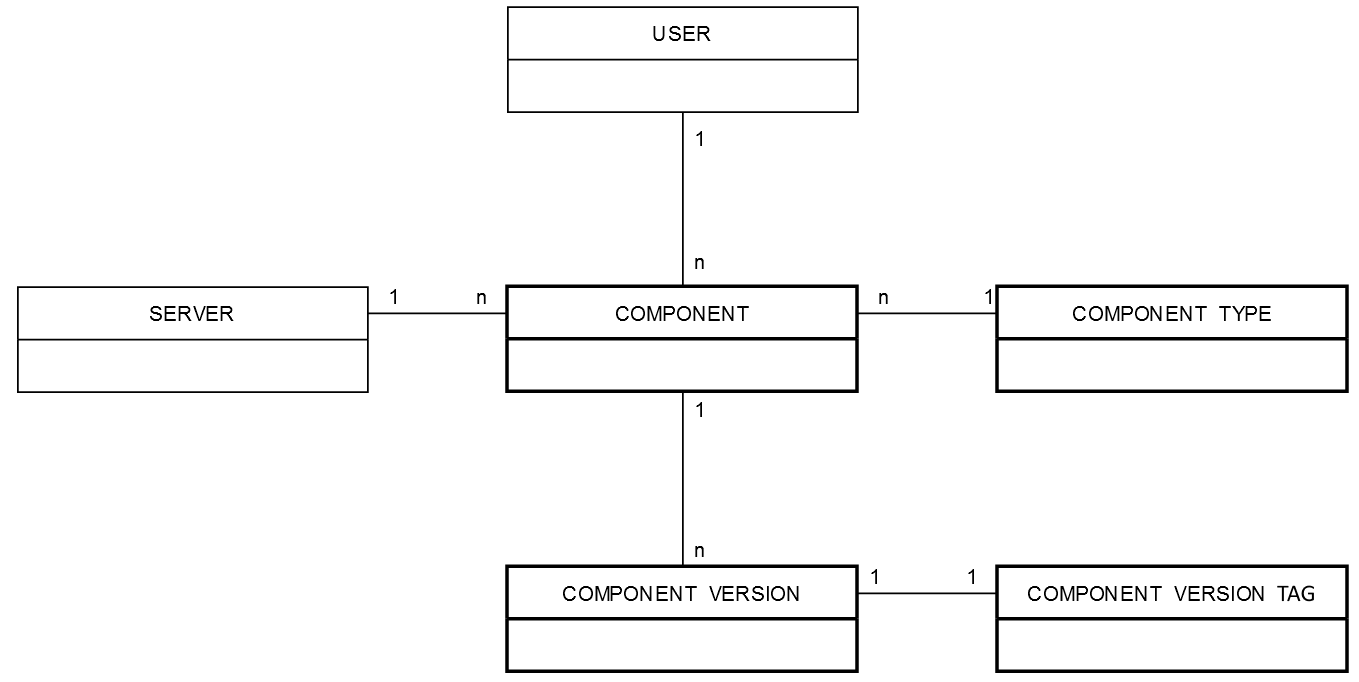
The COMPONENTtable includes information about all components, including their state. It is associated (1:n) with the COMPONENT TYPE table, and (n:1) with the COMPONENT VERSION table.
In order to simplify analysis using the most recent version on each component, the help table COMPONENT VERSION TAG is also available.
Data relationship model diagram for componentsand versions:
Jobs
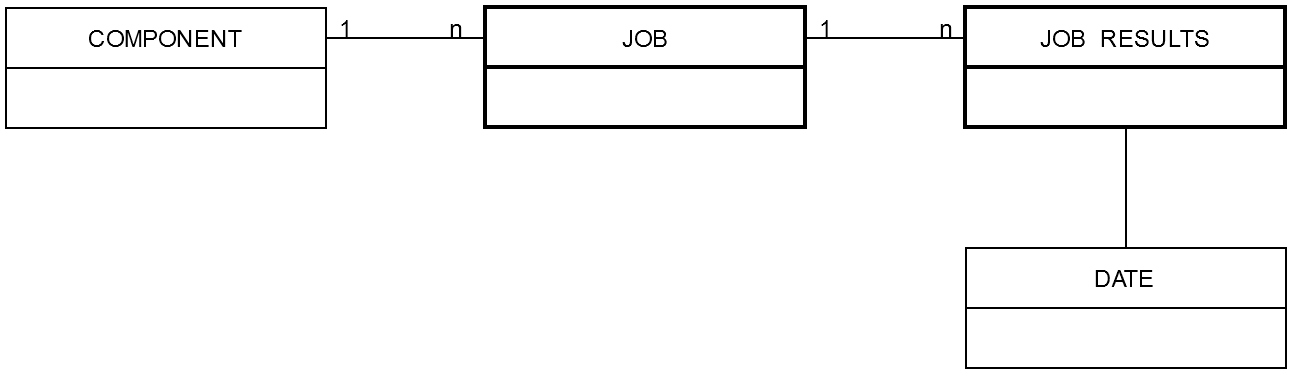
Information about Jobsand Job results are stored in corresponding tables JOB andJOB RESULTS. Multiple other tables can be used as dimensions when analyzing Jobs, for example COMPONENT. In particular, the table DATE is associated with the field “Job Start Date†of theJOB RESULTS table.
Data relationship model diagram for Jobs:
Assets
Asset information can be found in the table ASSET INFORMATION.
Logs
Log Information is available in the ADMIN LOG,EVENT LOG and COMPONENT LOG tables. These have associations with SERVER, USERand DATEtables.
Data relationship model diagram for Admin Logs:
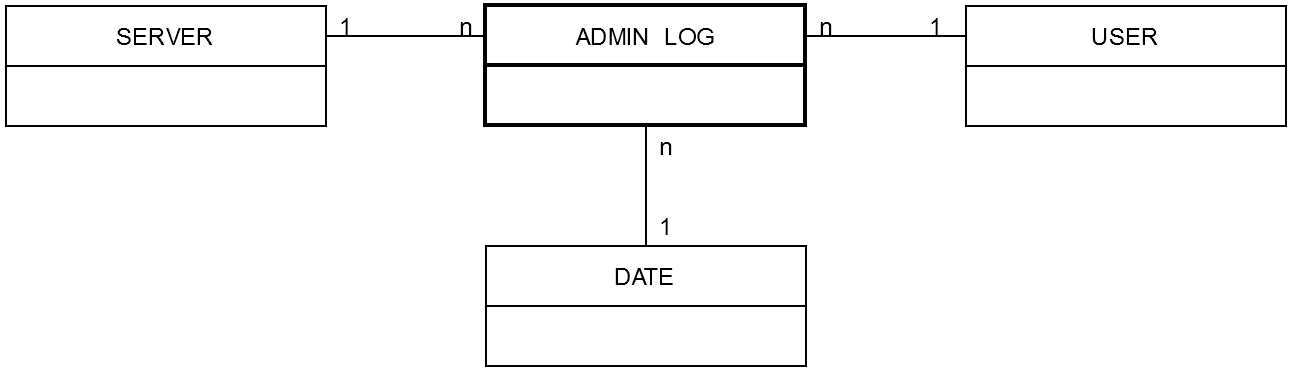
Note
The same relationship model is valid forEVENT LOG and COMPONENT LOG tables.
License and Usage Data
License and usage information can be found in the table USAGE UNPIVOT FACT LICENSE.
Technical Dimensions
The DATEtable can be used to filter multiple reports at the same time for particular dates; for example,‘JOB RESULTS'[Job start date] and ‘ADMIN LOG'[Log entry date], using the Filterslicer.
Note
The table TIME plays a similar role for times.
Accessing the Consumption Data Model
All predefined reports can be modified to create a custom report. See the following illustration for accessing the consumption model in any report: