Job statistics
The report Job statistics shows the comparison results between the newest Backup and the latest version. When data from the report is displayed, it is sorted according to current and previous results.
The current comparison results are shown in the form of a pie chart with different coloured segments as standard in the report. Current results are those based on comparison values that were produced at the system at the moment in the diagram The data is shown in the report based on pre-defined result types. Result types correspond to the diagram segments.
When selecting the area for which the results are to be calculated, this is done via project tree located in the dropdown menu. In the project tree, you have option to select directories as well as components. The display shown in the project tree is dependent on rights that the user has at their disposal.
Certain component types, those for example are not relevant for calculating job results, can be excluded when calculating job results. You can exclude component types by using a specially designated filter in the pie chart. The filter is launched by pressing the button Exclude component type. By using the tree shown in the filter, you have option to select the component types that are to be excluded when assessing the job results.
As soon as you move the mouse pointer over a segment in the pie chart, a tooltip will be displayed. In the tooltip, you can see the value and percentage. The value indicates the number of jobs in the segment. The number of jobs in a segment in relation to the total is shown via the percentage. The name of the segment is also displayed in the tooltip. All this information can also be found in the diagram history. Furthermore, the total number of jobs is shown in the history.
When you click on a segment or a line in the history, you will be redirected to the job list. You will then only see the jobs in the job list from the selected segments, meaning the selected result types.
In addition to current state of the comparison history being displayed, you can also see previous comparison results. You can swap between the current state and the job history by clicking on the drop down menu. For more information, see Change current state/history.
History results are shown in a line graph. As in the case of the pie chart, data in the line graph is based on pre defined result types.
Data is shown in job history by the day. By default, the current result of a job from 6:00 O’clock (local server time) is taken into consideration for the daily overview. The time can however be changed. If the mouse pointer is moved over the line diagram, a tooltip will be displayed. In the tooltip, the result types, that are visible in the diagram, are listed. For every result type, a value and percentage are shown. The value indicates the amount of jobs for the result type. The number of jobs of a result type in relation to total amount of jobs is indicated by a percentage. For this reason, the total amount of jobs is shown.
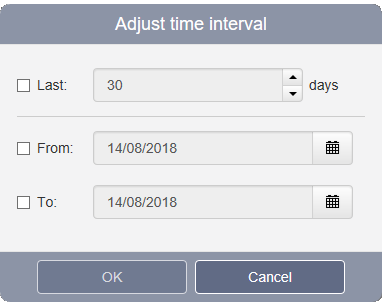
Filter Adjust time interval
The filter enables you to restrict the Job statistics display to a certain time period. Before selecting the desired time period, you need to check the appropriate checkbox.

Note
From versiondog 6.0 onwards, it is possible to calculate the previous value for the display in the line diagram.
