
Creating a slide show
Depending on your user rights, you can create a slide show that showcases select dashboards for the purposes of presentation.
- Click on the user icon (located in the upper right-hand corner).
- A dialog will open.
- Select the Slide show option
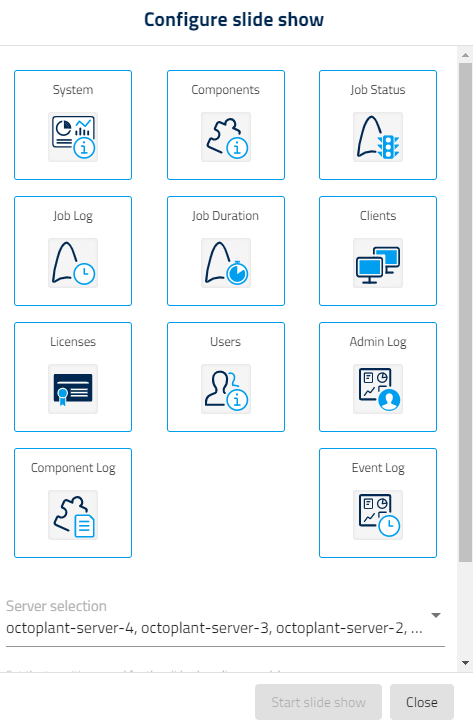
- The Configure slide show dialog will open.
- Image: Configure slide show
- Select the dashboards that you want to be displayed in the slide show. Initially, all dashboards are enabled for the slide show. This is indicated by the blue frame. To deactivate a dashboard or reactivate it, click on it.
- In Server selection, all servers, whose data will be shown in the slide show, are listed.If you want to limit the servers, click on the arrow. This opens the dropdown menu. From here, you can specify which servers you wish to include.
- In the Set the transition speed for the slide show (in seconds) field, specify how long you want each dashboard to be displayed on the screen.If you have only one dashboard enabled, this field will be greyed out and it will not be possible to configure the transition speed.
- Click on Start slide show.
- The slide show, showcasing the selected dashboards, will now be launched.
Note
To end the slide show, press the ESC key.
Last update: September 15, 2023